Diabetes Prediction Project
A self-initiated project to determine an appropriate algorithm to predict a patient having diabetes and its contributing factors.
A data enthusiast by day.
A sport fanatic by night.

This was a 1-week long competition held as part of The Analytics Edge course in SUTD. Students were tasked to form groups of size 3-4 and develop the most accurate algorithm (using R programming language) capable of predicting the sentiment of a tweet related to weather. These tweets can be of negative, neutral or positive sentiment. We were also provided 22,500 labeled tweets and 7,500 unlabeled tweets which make up the training and test csvs respectively.
We would be exploring different possibilities of data pre-processing to achieve an optimally processed training dataset to develop our algorithms. After which, we would adopt the various machine learning models taught in class and conduct additional research for potentially more accurate models to utilize.
We experimented several ways to optimize our approach to processing the training data. Eventually, we found the optimal data pre-processing approach which comprised of 3 key areas.
Another crucial part was to expand the training set by making use of a dataset provided by Figure Eight (formerly known as crowdflower). This was an open source dataset in R known as weather_crowdflower consisting of 763 weather related tweets and their respective sentiments. This enabled us to expand our training dataset further to around 23,263 records.
We utilize the TF-IDF algorithm which scores words based on the frequency it appears in the document and compare it to the aggregated frequency across all documents. We then extract a TF-IDF score for each word in the training tweets which allows us to determine the importance of the word in determining the sentiment of the tweet.
Lastly, we utilized N-Grams which is a continuous sequence of N words taken from a text. This enables more meaning behind the text to be captured unlike when words are split individually which would make the meaning difficult to interpret.
Finally, we could proceed with developing several approaches utilzing machine learning algorithms such as Classification & Regression Trees (CARTs), Random Forests, Support Vector Machines (SVMs) and Multiclass Logistic Regression.
Our most accurate approach utilized Multiclass Logistic Regression with k-fold cross-validation. Here, we tuned the model by setting k as 10 and utilizing the optimal lambda value which resulted in the lowest cross-validation mean error. Here is a summary of our other approaches:
| Method | Public Leaderboard (30%) | Private Leaderboard (70%) |
|---|---|---|
| CARTs | 0.81066 | 0.79695 |
| Random Forest | 0.84088 | 0.83600 |
| SVMs | 0.84133 | 0.83295 |
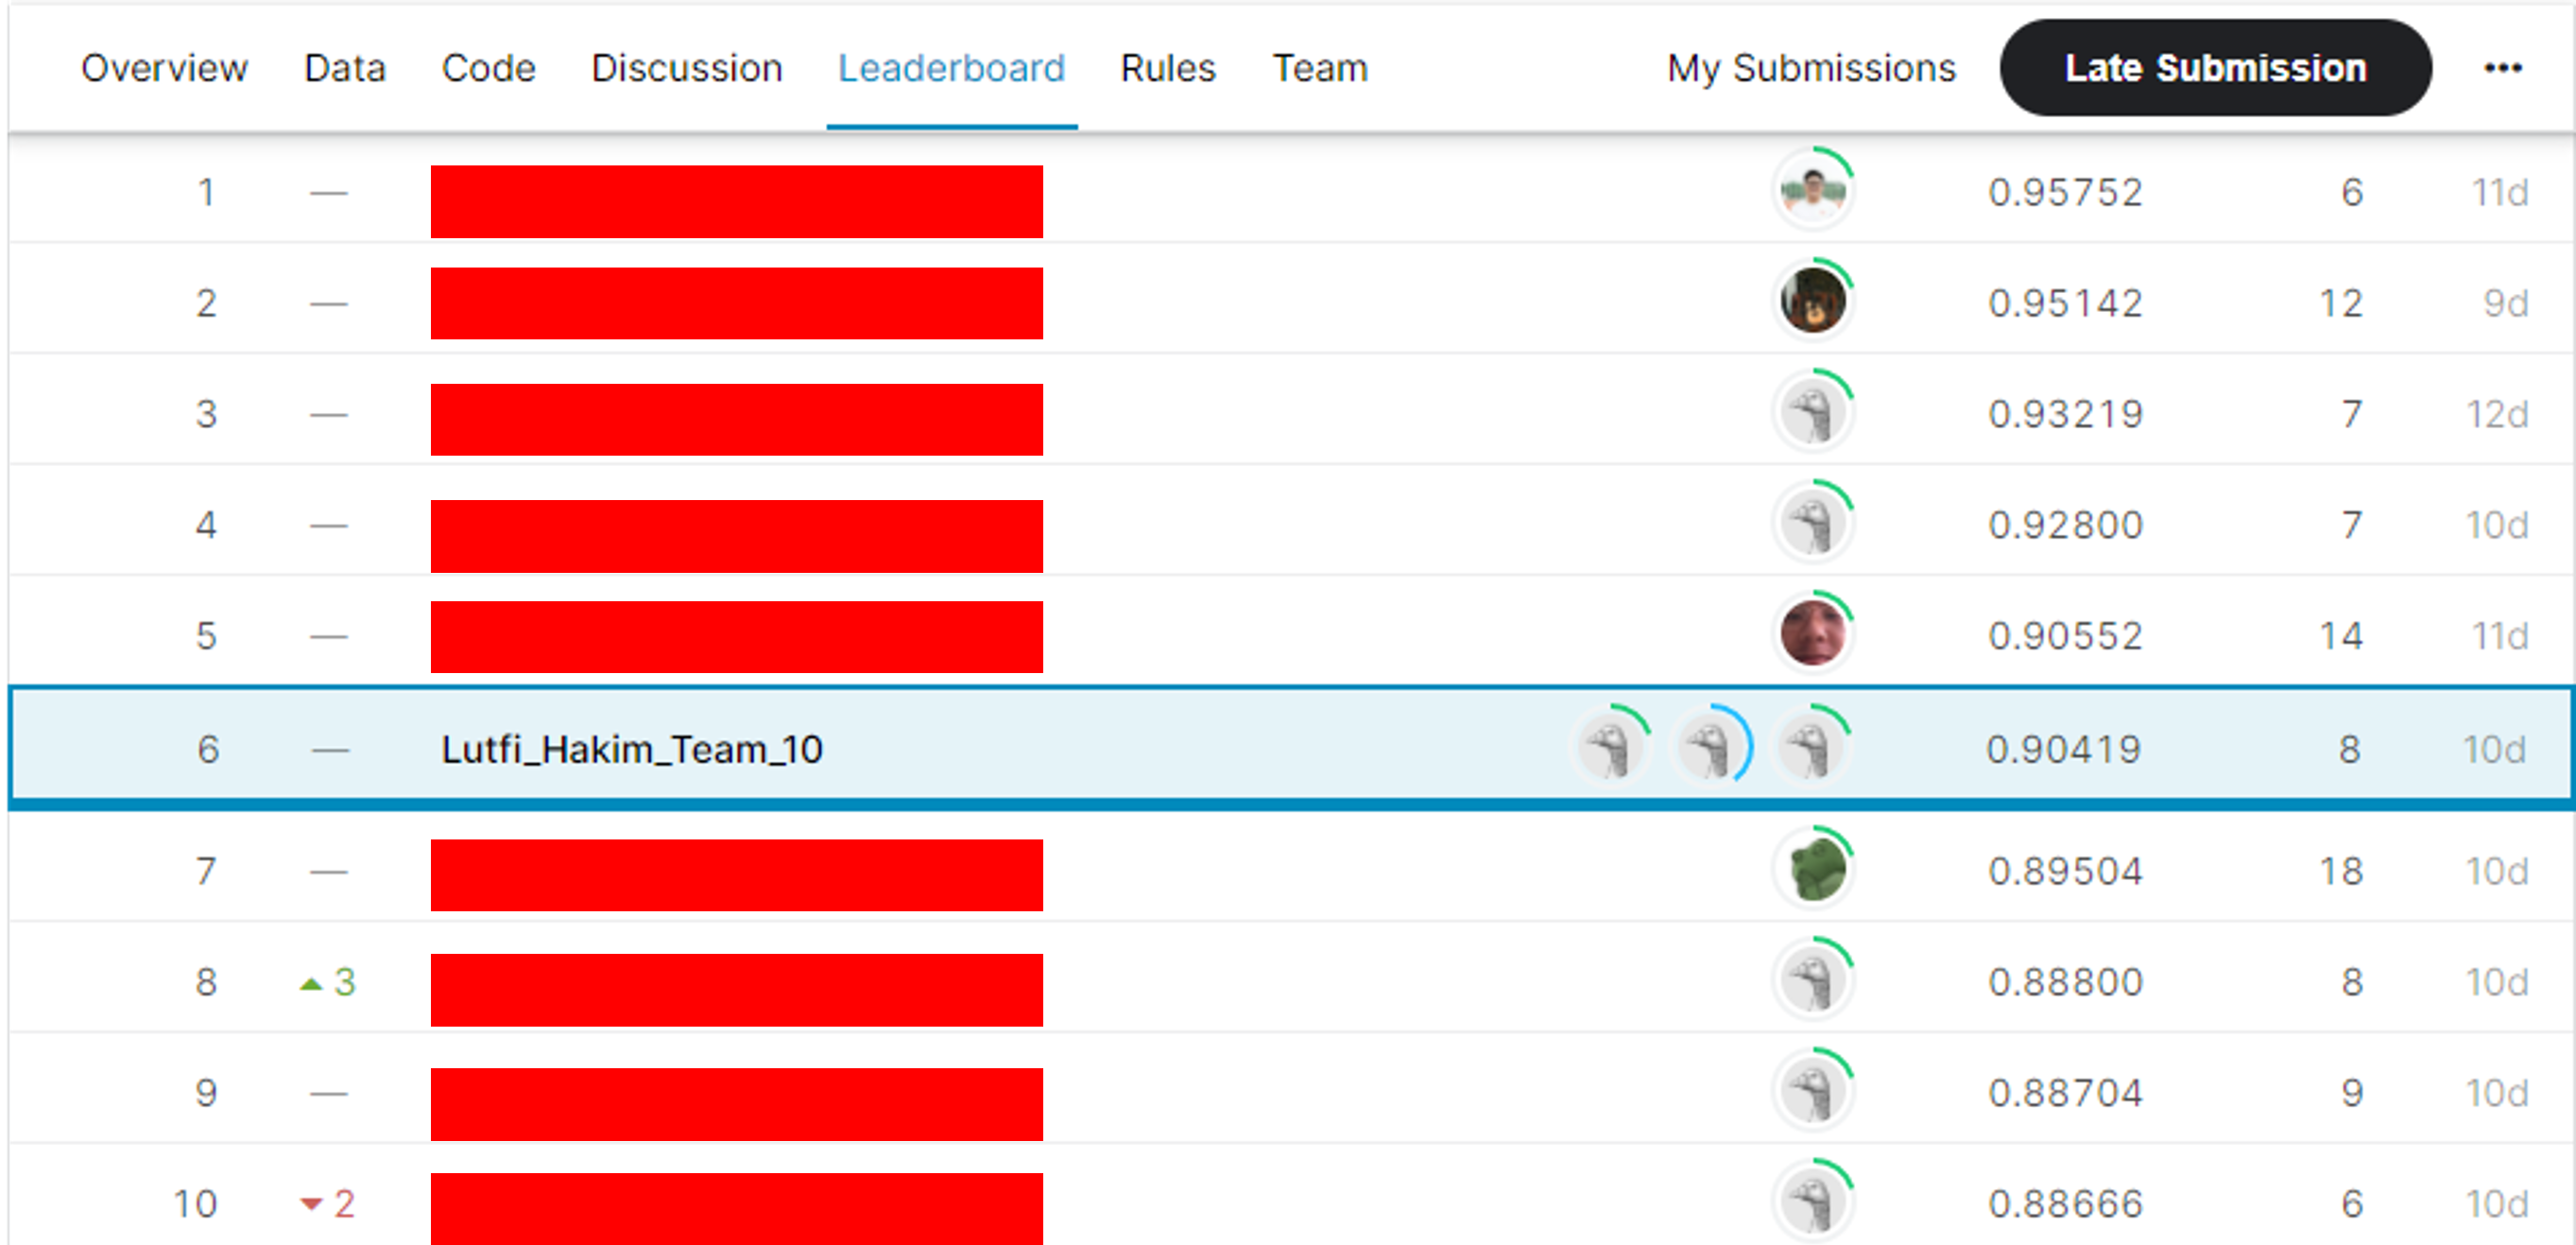
| Multiclass Logistic Regression | 0.90888 | 0.90419 |
Additionally, you can view the code for our best performing algorithm here.
Our group's best admission achieved a score of 0.90888 and 0.90419 on the public and private leaderboard respectively. This placed us 6th out of the 30 teams participating in the contest.

Outside of our work, we realised there were other methods we could have adopted to improve our accuracy. In particular, Long Short-Term Memory (LSTM) models and Convolutional Neural Networks (CNN) are often used for Natural Language Processing tasks such as this. However, due to a lack of knowledge and time, we were unable to have enough exposure to create a well-performing model.
Overall, this was an enjoyable and enriching competition which put our knowledge from the course to the test in an appropriate manner. Will be looking forward to participating in future competitions on kaggle from now on! :-)
Some of the work done as school projects and on my own time to put into practice some of the technical knowledge gained.

A self-initiated project to determine an appropriate algorithm to predict a patient having diabetes and its contributing factors.

A self-initiated project to create an interactive dashboard to visualize the population of motor vehicle users in Singapore from the year 2005.